How to Build a Wear Measurement Log That Predicts Replacement
One measurement tells you where a part is today. A consistent series tells you how fast it is changing and when to prepare parts, labor and downtime. The key is repeatability: same datum, same tool, same position and enough operating context to explain changes.
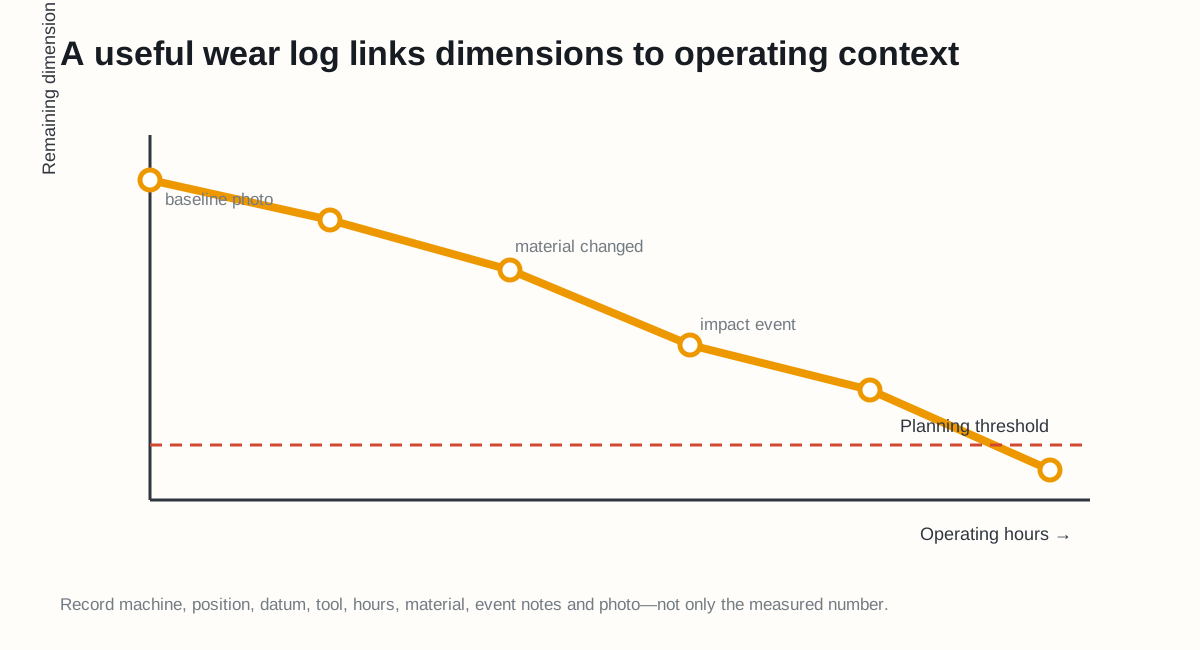
Figure 1. A trend becomes useful when changes in material, route or impact are logged beside the measurements.
Define the measurand
Write exactly what is measured—for example, “distance from centre of bolt 4 to the working edge, perpendicular to the original edge.” Avoid vague fields such as “blade thickness” when the technician could choose different positions.
For each component define:
- Machine, attachment and component position
- Datum and measurement direction
- Tool and resolution
- New-part baseline
- Manufacturer’s planning and replacement limits
- Inspection interval
Minimum log fields
| Field | Example |
|---|---|
| Date / meter | 15 Jun / 2,420 h |
| Position | Loader edge, centre |
| Reading | 18.6 mm |
| Repeated reading | 18.7 mm |
| Material | Crushed granite |
| Hours since last check | 120 h |
| Event | Two high-impact shifts |
| Photo ID | WL07-2420-C |
| Action | Shorten interval to 60 h |
Calculate a transparent wear rate
If a reference dimension changes from 26.4 mm to 22.8 mm over 300 hours:
Wear rate = (26.4 − 22.8) ÷ 300 = 0.012 mm/h
If the approved minimum is 16 mm:
Simple remaining estimate = (22.8 − 16) ÷ 0.012 ≈ 567 h
This is not a guarantee. It assumes future wear resembles the measured interval. Use the recent rate when conditions changed, and schedule with a margin based on inspection interval and parts lead time.
Watch for acceleration
Compare rates by interval rather than fitting one lifetime average:
| Interval | Loss | Hours | Rate |
|---|---|---|---|
| 0–300 h | 2.4 mm | 300 | 0.008 mm/h |
| 300–600 h | 3.6 mm | 300 | 0.012 mm/h |
| 600–750 h | 2.7 mm | 150 | 0.018 mm/h |
The example rate is accelerating. Possible explanations include a changed profile, more abrasive material, a new operator route or a loose joint. Investigate instead of trusting the lifetime average.
Treat uncertainty honestly
If repeated readings differ by 0.3 mm, a reported change of 0.1 mm is not persuasive. Clean the datum, repeat the reading, check tool zero and record a range. NIST notes that measurement uncertainty includes components from statistical variation and systematic effects. See NIST Measurement Uncertainty.
Make the log actionable
Use three thresholds:
- Routine: normal inspection interval.
- Planning: order parts and shorten the interval.
- Removal: the manufacturer’s limit or a safety defect is reached.
The fastest-wearing position controls the decision. Do not average a critical corner with a lightly worn centre and hide the risk.
Sources
- NIST: Measurement Uncertainty
- NIST: Dimensional Measurement Uncertainty
- Caterpillar: Choosing and Maintaining GET
Data note: all numbers are illustrative. Use manufacturer limits and your verified field measurements.